Analytics
Understand traffic, journeys and media impact across your venues
From entrances to stores, from audiences to journeys, Digeiz turns video into actionable insights at every level of your asset.
One platform, multiple levels of analysis
Visitor journeys & behavioral insights
What you unlock
- Store-to-store journeys
- Entry → path → exit analysis
- Cross-visits between stores
- Category interactions
Key metrics
- Number of stores visited
- Cross-visit rates
- Sequential visits
- Journey patterns
Why it matters
- Understand real visitor behavior
- Optimize tenant mix
- Support leasing decisions
- Measure impact of media
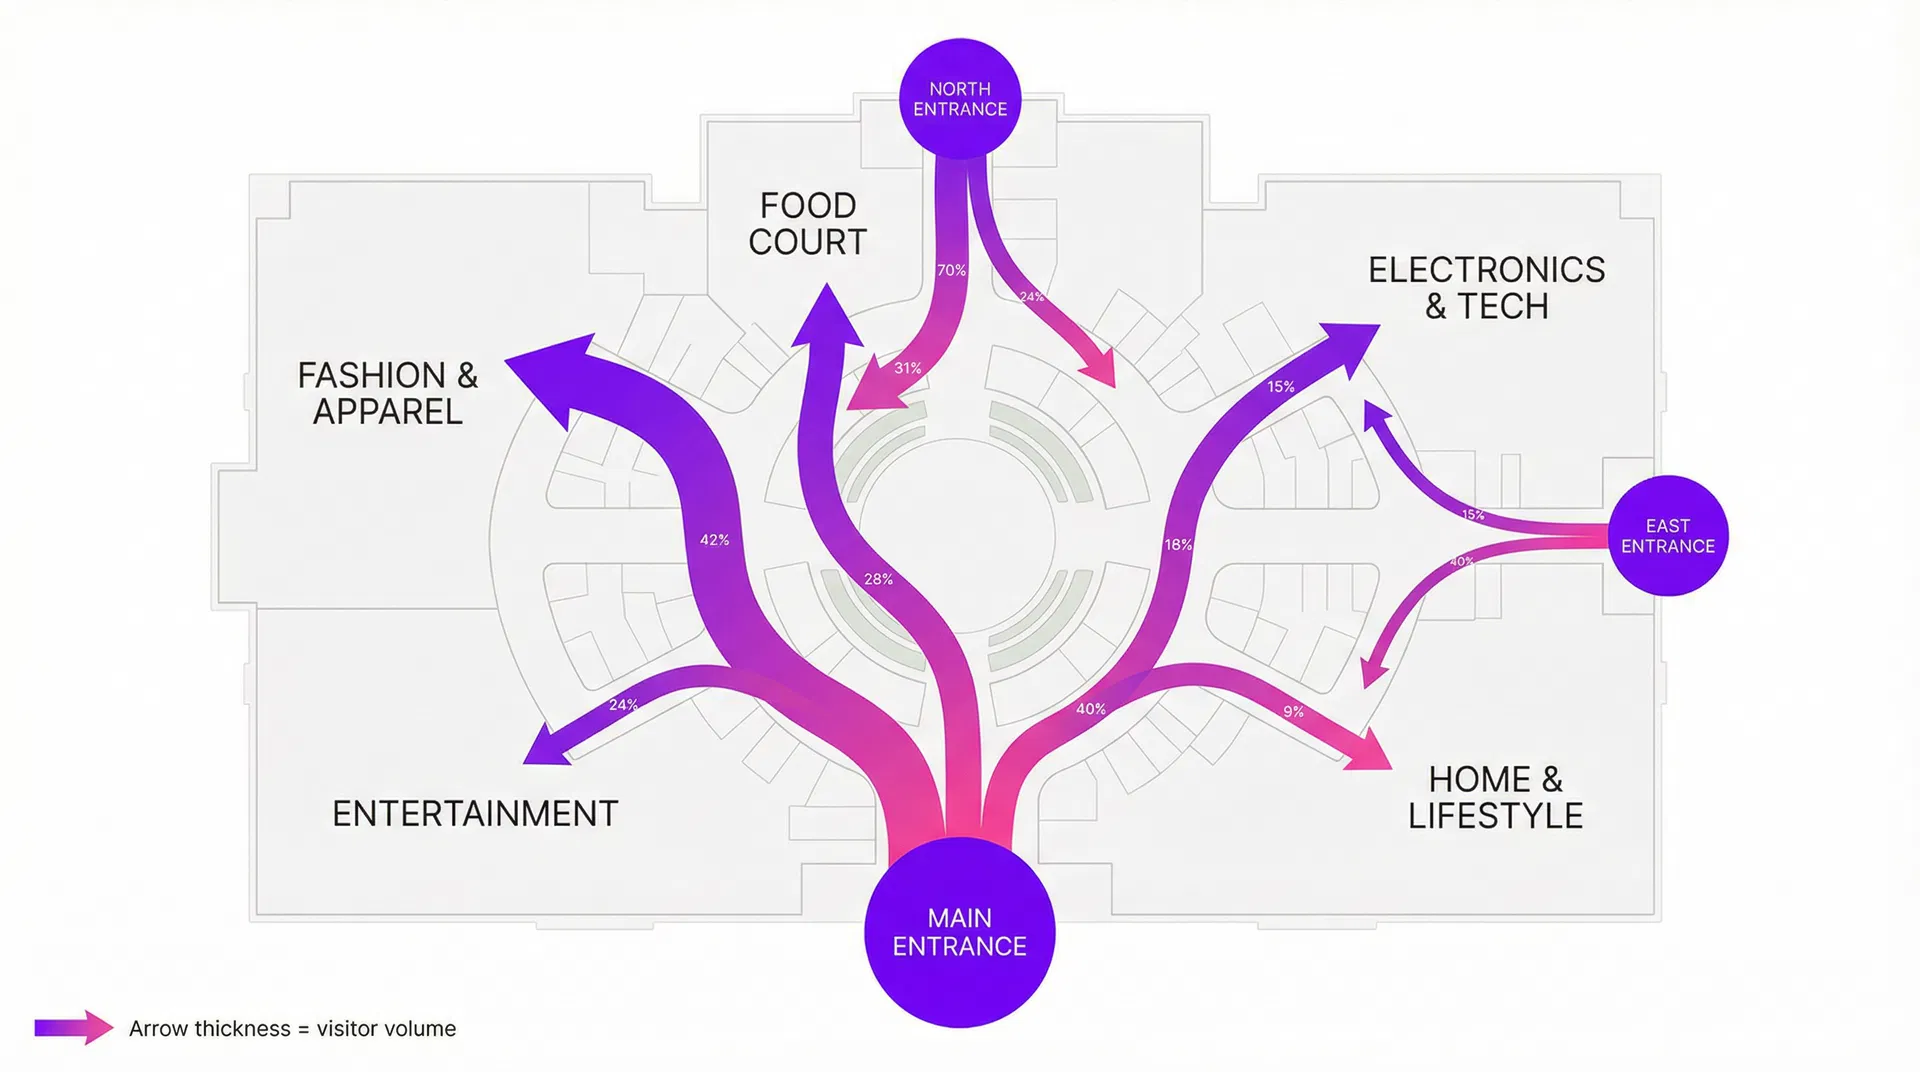
42% of Main Entrance visitors head to Fashion & Apparel first
70% of North Entrance traffic flows directly to the Food Court
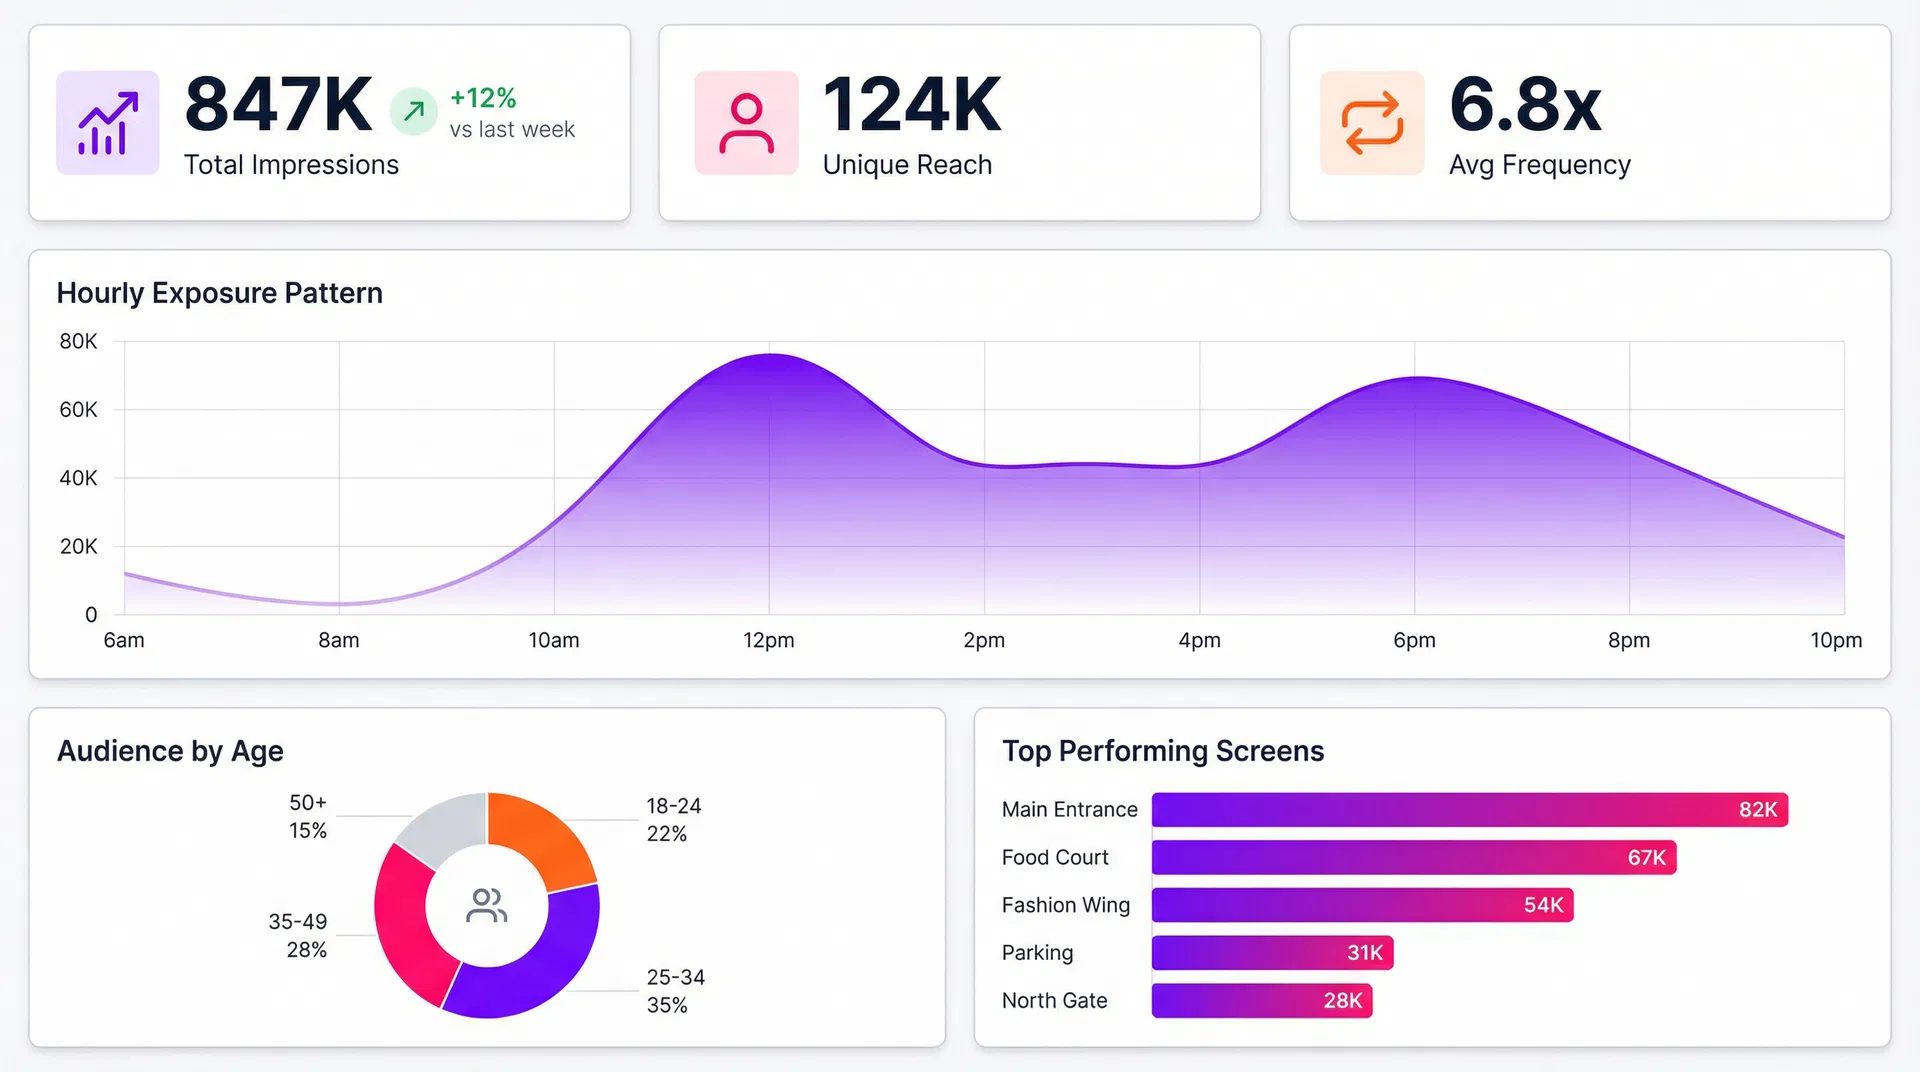
Retail media & campaign performance
What you measure
- Audience exposure
- Reach & frequency
- Repeat exposure
- Audience demographics
What you prove
- Incremental visits
- Conversion impact
- Category uplift
Example insights
- % exposed visitors visiting a store
- Incremental traffic generated
- Campaign vs baseline performance
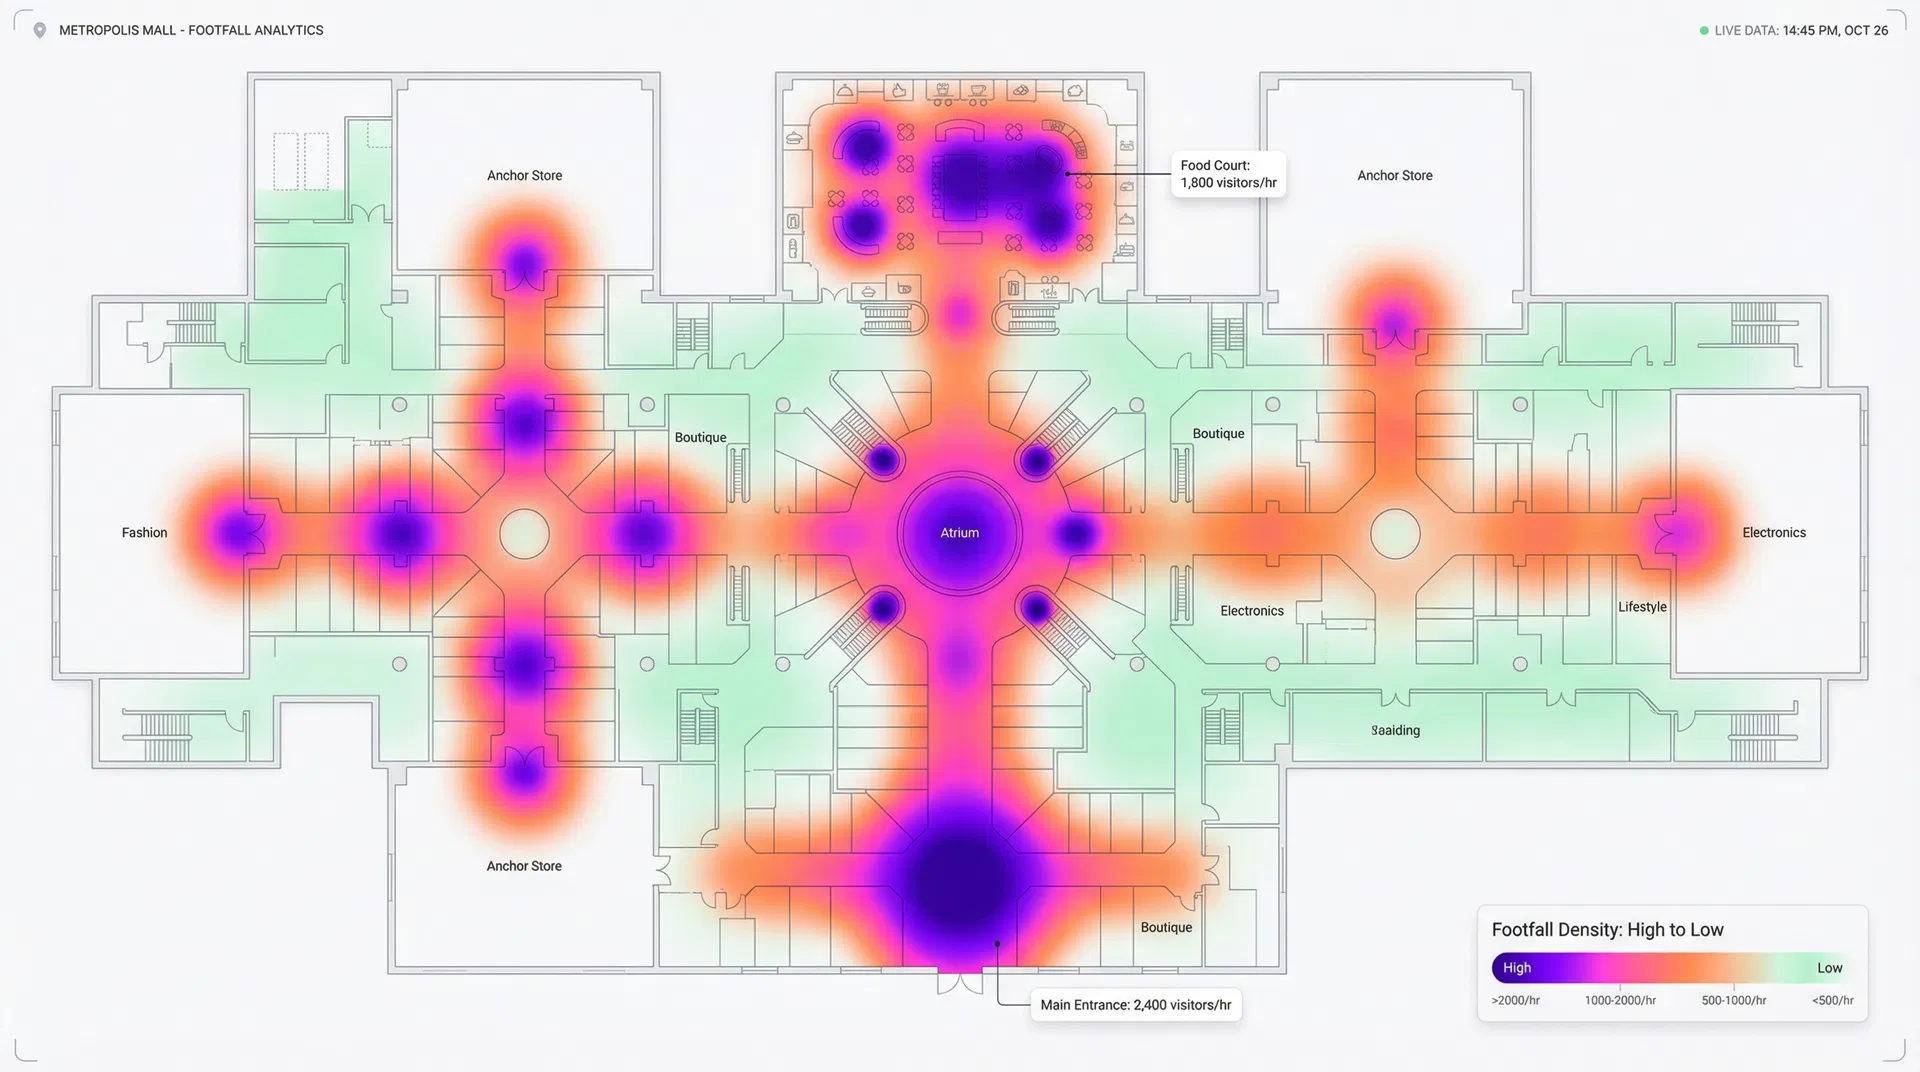
Footfall & traffic intelligence
What you measure
- Entries / exits by gate, zone, store
- Traffic distribution across the venue
- Peak hours and temporal patterns
- Flows between areas
What it enables
- Identify high-traffic zones
- Optimize circulation
- Track performance over time
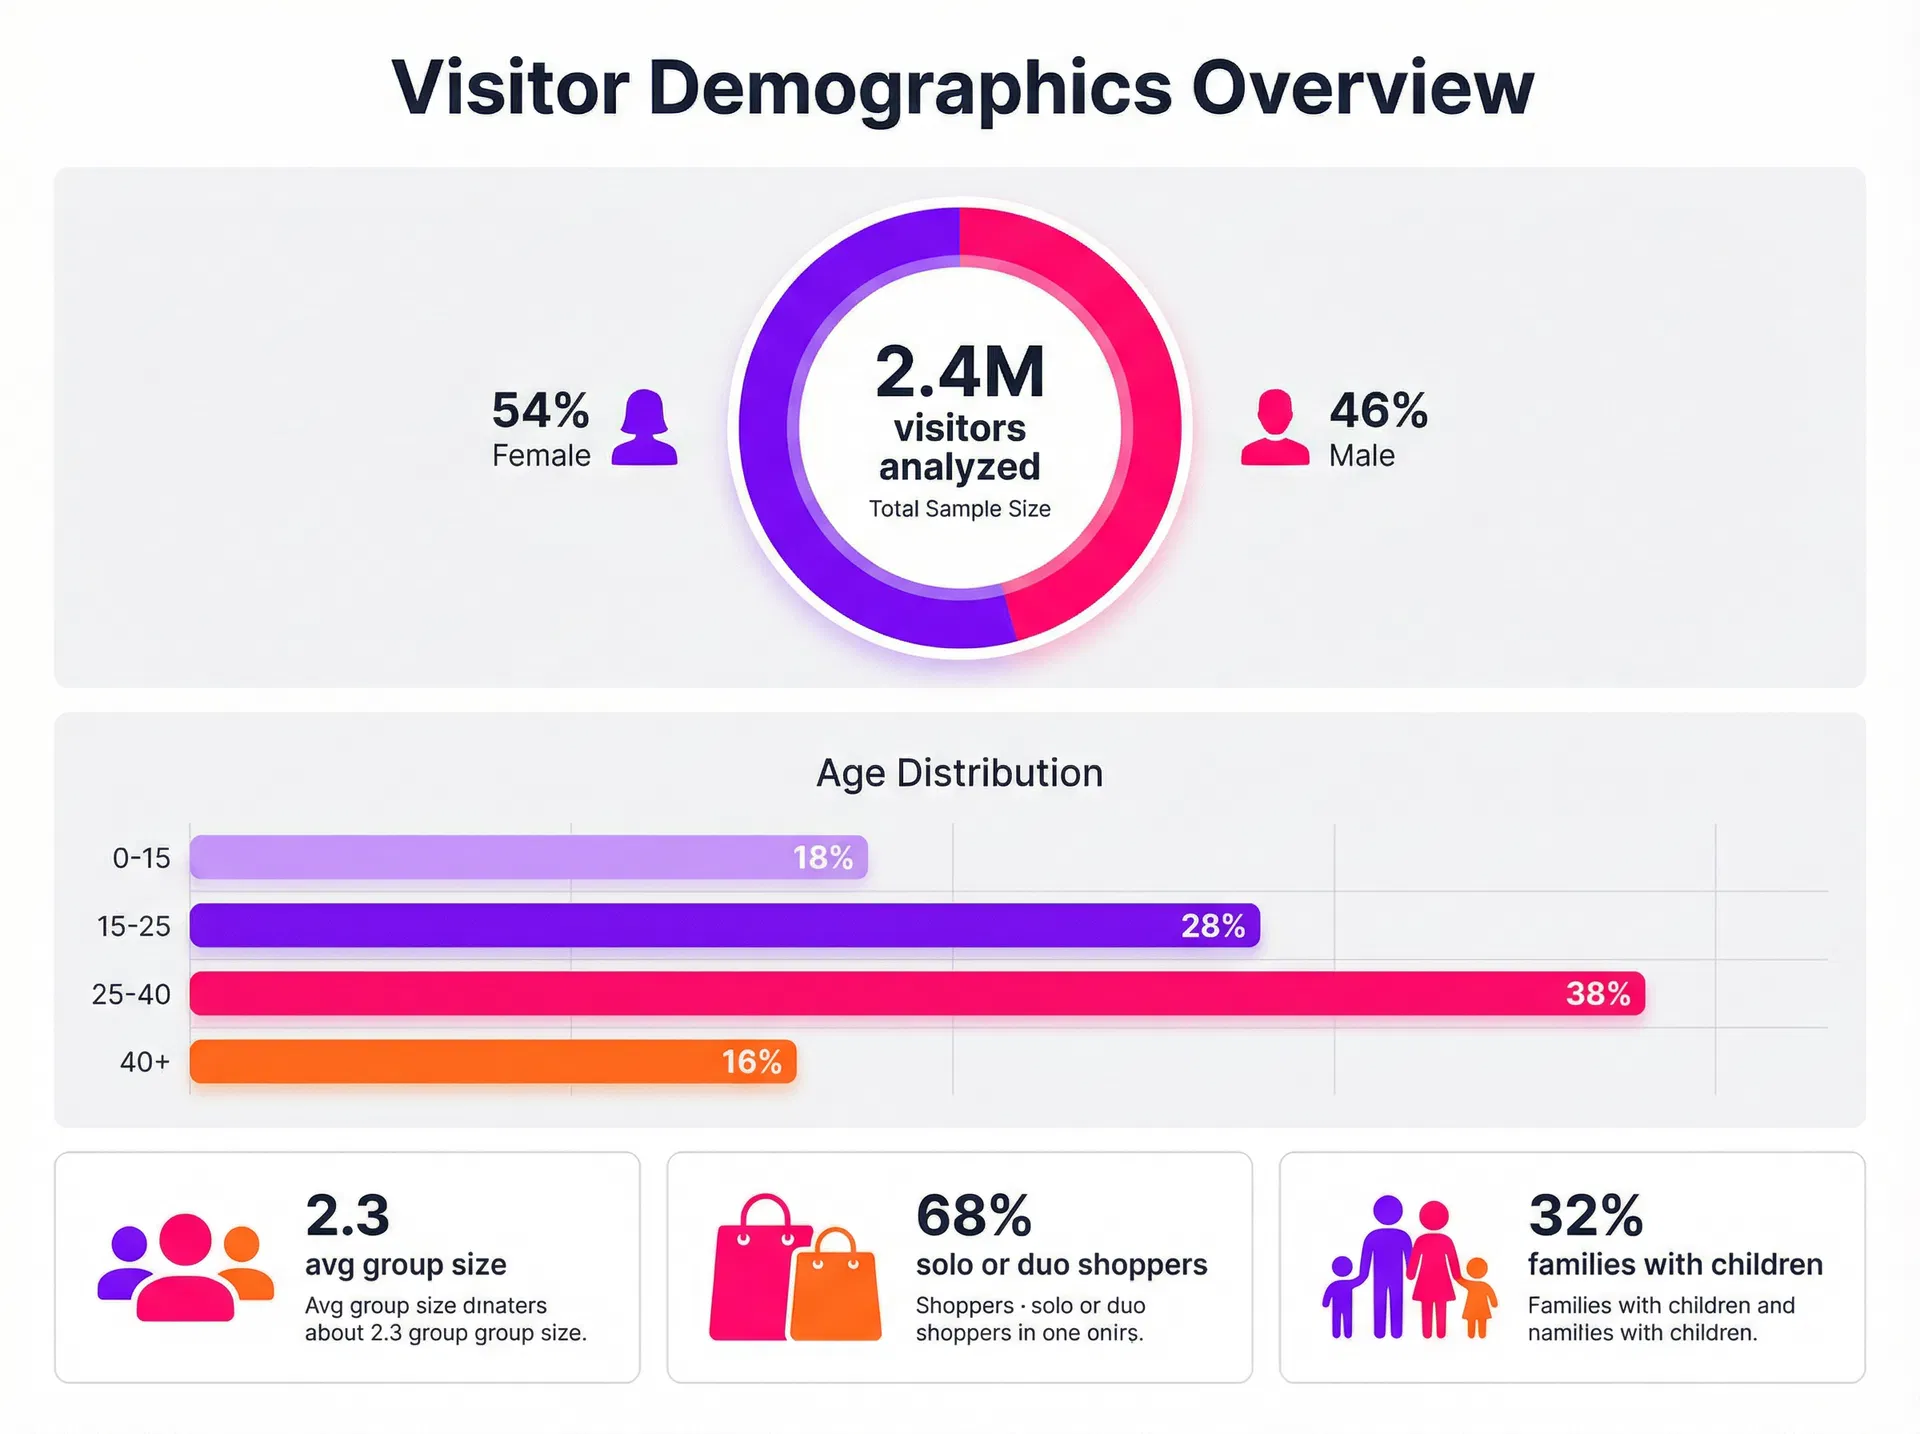
Audience & visitor segmentation
Segmentation
- Gender (Male / Female)
- Age groups (0-15, 15-25, 25-40, 40+)
- Group size
- Category-based audience segmentation
What you understand
- Who your visitors are
- How audiences differ by zone
- Which audiences drive performance
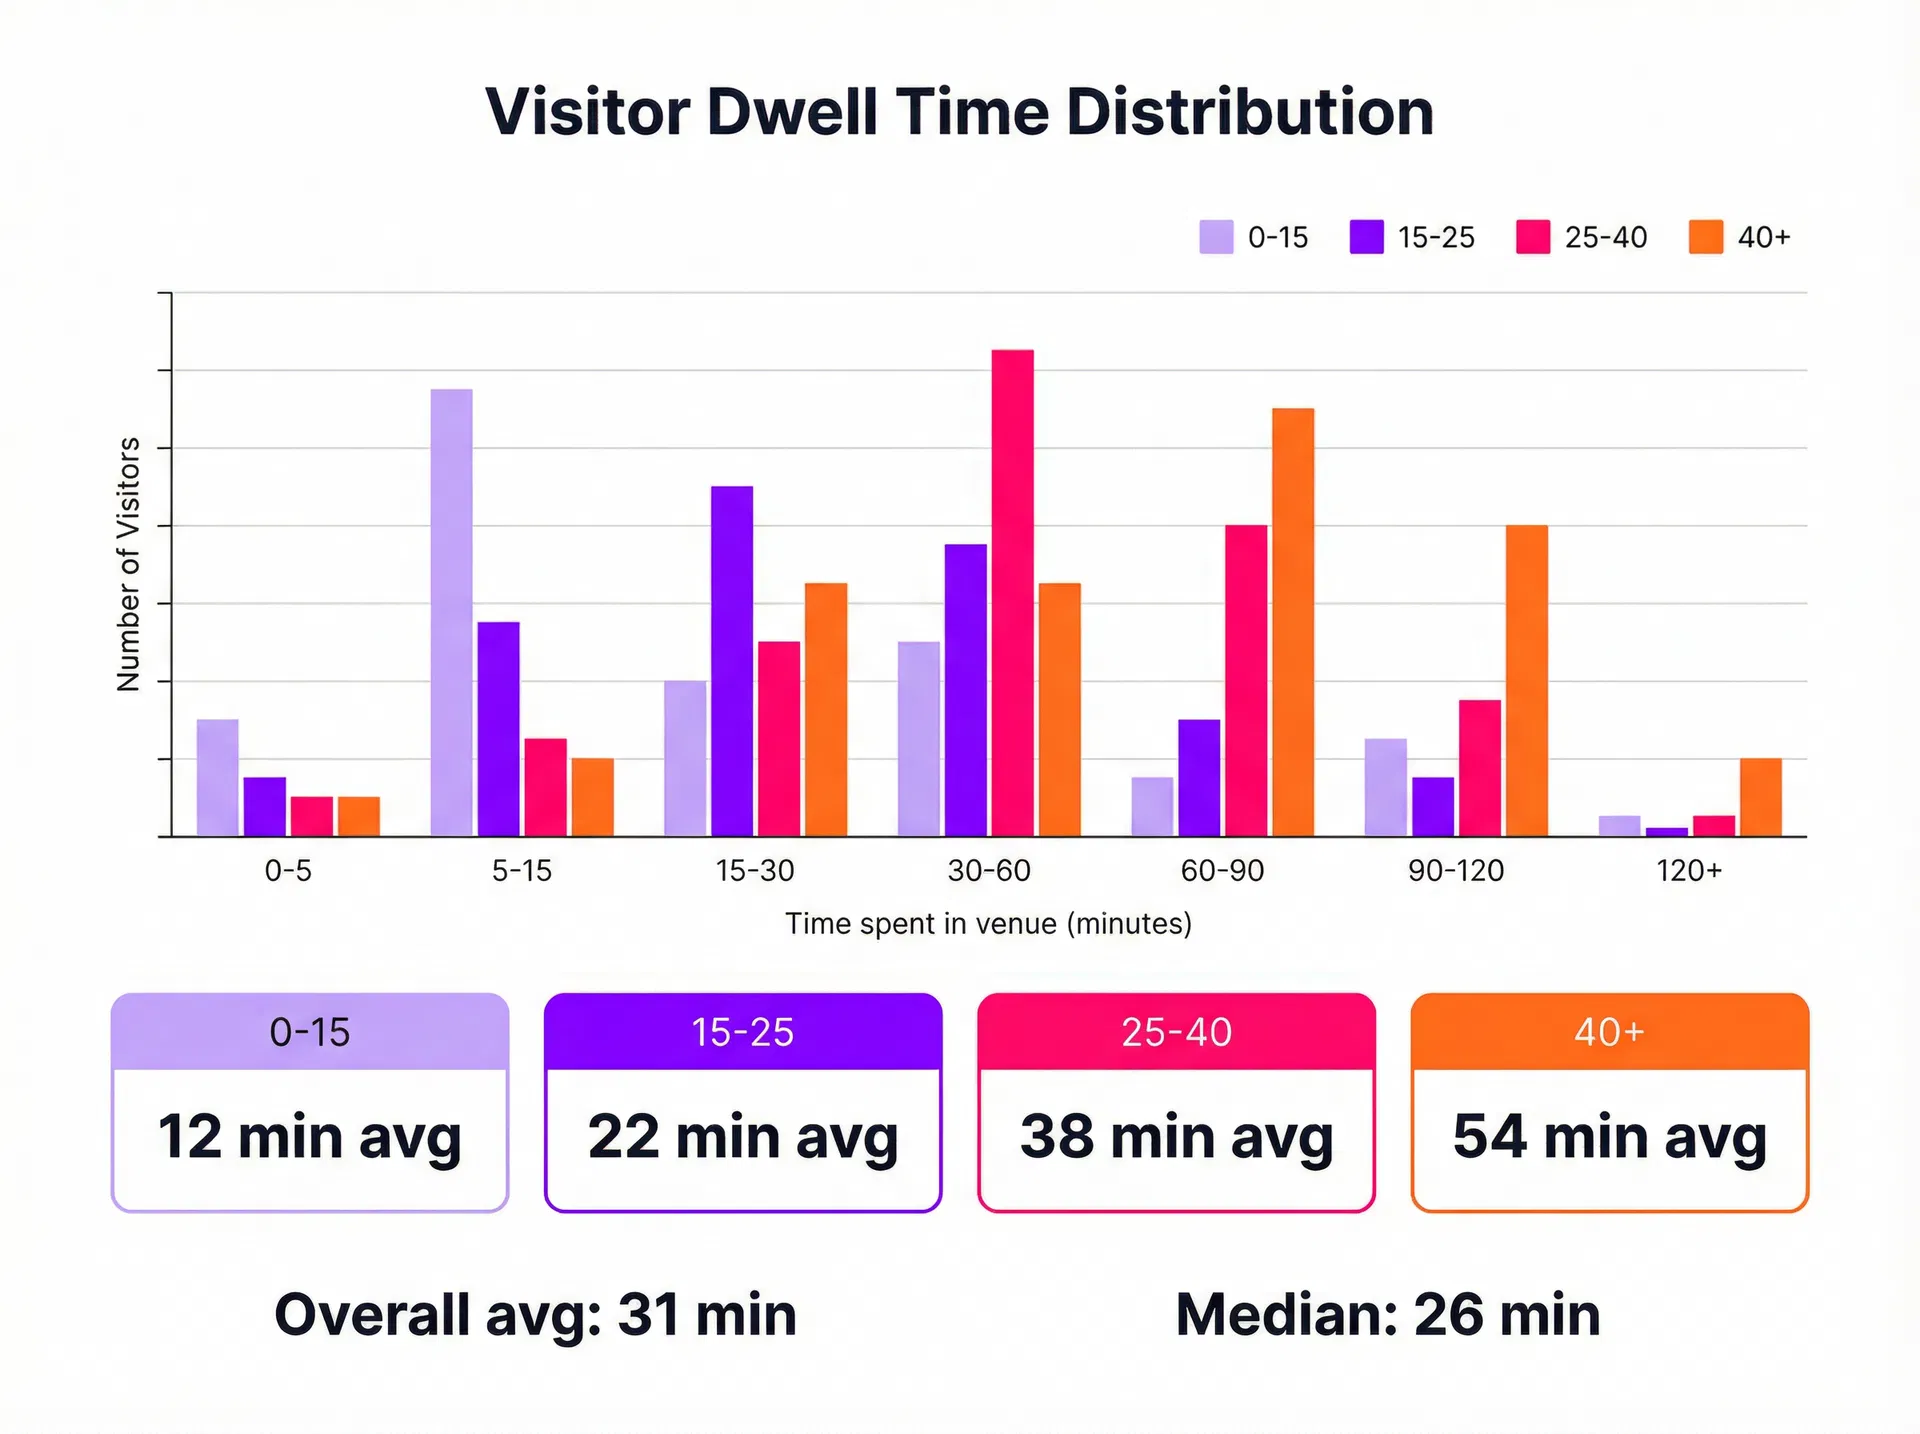
Dwell time & engagement
Metrics
- Average dwell time
- Median dwell time
- Time spent per zone / store
- Bounce rate
Insights
- Identify high engagement zones
- Compare store attractiveness
- Detect friction areas
Access your data. Activate it everywhere.
Dashboards
- Interactive dashboards across all levels
- Custom views per team
- Real-time and historical analysis
Mall dashboard with filters
Automated reporting
- Scheduled reports
- Custom recipients
- Performance tracking
Daily / weekly timeline
APIs
- Full data access via API
- Structured endpoints: footfall, journeys, dwell time, media performance
- Scalable data pipelines
{ "footfall": 12450, "date": "2024-01-15" }
Integrations
- BI tools (Power BI, Tableau)
- CRM
- DSP / SSP
- Internal tools
Architecture
Cameras
Digeiz Platform
Dashboards / Reports / API
BI tools / CRM / Media platforms
The same data, used differently across your organization
Every metric on this page supports decisions made by different teams. Explore how each one uses the data: